http://www.youtube.com/watch?v=W2NFkCNIDxI
Now that that is out of the way, I wanted to address a smoldering hot issue: V (Visa Inc). Today presented itself with a unique waterfall event in V shares as it got pummeled after some news on the credit card fee issue (effects MA and others as well).
A stock that is rolling down a hill like a massive snowball is not a trade for most, and I do understand that. There are, however, those of us who will at times spring in to action to trade the reaction to such a drastic drop in share price. I will take my Welding Gloves out of the freezer, put them on, and get focused.
I am one of those. I will do Knife Catch plays when appropriate. So why the fireman reference? Well I searched for an analogy that would somehow put into perspective just how prepared one must be to execute a Knife Catch play -- in order to ensure the higest probability of success. So I figured who better to reference than a fireman.
If you consider what a fireman must do to stay ready at all times, to be able to act on a moments notice, it seems quite relevant in comparison. In the case of this type of trade, you have to be ready in mind, body, & spirit to tackle a trade where emotions are running at elevated levels. You have to understand support levels, certainly understand technical analysis in detail, but in addition - you have to know how to be calm.
During the course of the drastic drop in price, I made the decision to trade JAN call options. I chose the 75 strike. This is my bet of choice on more higher priced stocks, especially when I want to make a significant bet.
I prefer to buy call options when no one wants them, simple.
Thursday, December 16, 2010
Monday, December 13, 2010
x^
What on earth does that mean?
MACD x^
I often get questions regarding some of the info that I provide in my charts. Given the nature of the character limit in Twitter, I have to get creative in my abbreviations. In the case of the line above, I am referring to a "cross up of the MACD indicator". A recent example can be noted in MIPS (Mips Technologies Inc).
One of the frequent trades that I look for is the MACD cross up. It works with incredible reliability, and is a trade that I can find on a daily basis. In the case of MIPS, the cross up occurred on 12/10/2010, and was confirmed today 12/13/2010 (next trading day).
This cross up of the MACD does not always happen at the bottom, so be mindful of that.
Sunday, December 12, 2010
Playing with Crayons
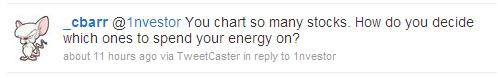
I received a question in a tweet this weekend that I thought I would address in a blog post. The question was from @_cbarr:
 The more I thought about the question, the more I realized that I have several distinct reasons for putting the energy into generating a chart. My reasons can be summed up:
1) To make the chart available to the community, to share it. Since I view many charts at CHART.LY myself, it only seems fair that I do my part to contribute.
2) If I am in the middle of trading a stock, long or short, I will typically post an update to the chart when an event happens to the stock price. Possible events are:
4) One final reason is because the posting of the chart will generate feedback to me. This is very valuable to me for many reasons, even if it is criticsm. I am a good listener, and welcome it regardless.
5) Bonus Reason. I like playing with Crayons.
1) To make the chart available to the community, to share it. Since I view many charts at CHART.LY myself, it only seems fair that I do my part to contribute.
2) If I am in the middle of trading a stock, long or short, I will typically post an update to the chart when an event happens to the stock price. Possible events are:
- Gap down or up
- Falls through TL (Trend Line) or Horizontal Support
- Breaks above TL (Trend Line) or RES (Resistance)
- Makes some other material move that causes me to adjust my trade. This could be to scale in or out, or even exit the position. This would include a buy trigger as well.
- There are times, like in the case of a "coil" trade, that I will post a chart update just reflecting that.
- View changes from bullish to bearish, or vise versa.
4) One final reason is because the posting of the chart will generate feedback to me. This is very valuable to me for many reasons, even if it is criticsm. I am a good listener, and welcome it regardless.
5) Bonus Reason. I like playing with Crayons.
Friday, December 10, 2010
Relax
This week provided me with several key moments in several trades where I needed to get a grip. One such example was with ARG (Airgas Inc). I am long the position in my swing account, and on thursday both ARG and APD were halted for a time. Then some news was released regarding the buyout offer being raised to 70 a share.
ARG opened much lower and I had a tough decision to make. My trailing stop was at 60 (I had entered at 61 from a knife catch play), but I had a critical decision to make. Nervous Ninny!
I decided to Relax. I took the advice from @TraderFlorida, something he tweets frequently, and it seemed like a simple thing to do. I decided to leave the trailing stop in place, and monitor for dip buyers. It does appear that others viewed the 62 level as a nice spot to step in. As of noon today, the stock is sitting at 63.80 -- a nice steady recovery.
Relax.
Tuesday, December 7, 2010
Tools in the Tool Belt
With a growing list of followers on Twitter, I've begun to realize that there is something that comes along with each tweet that I make: a responsibility for the information that I provide. There are folks out there that have taken the time, and interest, to follow me (and again, thank you for that) -- and so one needs to consider many things when posting. What message am I trying to convey? Is it valuable to anyone else? Will they care, etc.
My reason for pondering on this today stems from several emails/tweets that I received over the weekend that centered around FOCUS. I am increasingly asked questions regarding how I can be focused on a variety of uniquely different trades - especially if they are in play at the same time. I wonder sometimes myself!
All kidding aside, I want to address the issue of Focus. I could spend a lot of time addressing each type of trade and why I utilize them, but for now I will generalize each type as a "tool in the tool belt". As is true with using tools, each one is designed for specific tasks. A screwdriver, well, you use it to screw in screws. A hammer, you now what to do with that one. The same holds true with a type of trade. A knife catch takes a certain type of preparation and execution that is vastly different from a Breakout play. Obviously a stock has to be in a gapping down situation for the knife catch "tool" to be used.
So I have several "tools" out and I'm using them to build a portfolio. In order to focus on each trade, I utilize a Trading Journal that is built within Excel with numerous columns. I specifically designate each trade appropriately, and have a ranking system that I use. This Trading Journal includes special columns that are unique to each type of trade, like a different price alert setting for example. This is one way to stay focused on my strategy and goals for each trade. In terms of how I manage each trade, I've learned to keep seperated trading accounts. My swing account is used for trades over 2 days. The options account is for option trades. The Long Term account is for stock that I want to hold and sell calls against. My daytrade account is used for quick intrad-day trades that come up during the day.
By using a properly designed Trading Journal, seperate accounts, defined strategy for each type of trade this should help in managing a portfolio of trades. This should improve your Focus.
Thursday, December 2, 2010
Pass the ketchup
I have been asked a few times about stocks that appear to have conflicting indicators. I came across one tonight in my scans that falls into this bucket. The stock is HNZ (H.J. Heinz Co).
What I noticed in this chart today was that the MACD was bottoming and starting to make its way up (reading at -0.2). However, the STO was quite high with a reading at 77.33 -- and so you have two indicators here that are not aligned. So what does that tell you about the stock?
What I see is that it had quite a sharp quick decline, and then a more gradual return up a Trend Line. Thus the STO is more advanced in its movement that what the MACD shows. The convergence of the 20d & 50d moving averages contributes to this as well.
Given the wedge play strategy here that I have for HNZ, this presents itself as a good entry spot. The stock price is above all moving averages, and the volume as of late is great.
So don't pass the ketchup after all. LoL.
Do you have the time?
I've had a great discussion today with a few traders regarding a chart I posted on 12/1 for TEG (Integrys Energy Group). I typically post Daily charts, and in this case it showed a bottoming MACD & STO. It also showed that it was testing the rising 200d below. I put it on my stalk list to watch for a bounce, and set some alerts.
But wait a minute. What about the other time frames? Weekly? Monthly? That is what drove our discussion today as several traders had pinged me about what I was seeing on ALL the different time frames.
In reviewing the Weekly chart, one can see that the stock has been pulling back all month (and looks to be headed to test the rising 50d just below). That's important! On the Monthly chart, it is showing to be holding at the 8d EMA & 10d VWAP. That's also important!
Taking in to account all the time frames, what was the trade? The overwhelming view is that it continues to weaken and should test the 47 level soon, so a short was in order.
My take away from this collaboration is this: Always be open to listen, Always be willing to question yourself, Always be open to reassessment. I for one do appreciate the fact that others will question my charts, I'm not sure they realize just how helpful that is to me.
Thank you StockTwits.
Wednesday, December 1, 2010
Wrong
I've spent some time today doing a deep analysis of a trade I put on 11/30 for APKT (Acme Packet Inc). My thesis for the trade was simiple: the stock had experienced a big move in one day, so I wanted to play the "fade" -- a pullback in the stock. Seemed reasonable for a pullback to occur.
My strategy was to buy the Dec 45 PUT for 1.00 -- I like buying puts when no one wants them. It all seemed to make sense to me when I put the trade on.
So what went wrong? The stock is up another 8% today (12/1) so that trade is currently a loser. For a momentum trader, I showed poor regard for what the chart was showing me. I was convinced that it would pullback, but the chart was clearly telling me something else. I was wrong for that reason - it didn't do what I "thought" it would do. Now it certainly will pullback at some point, and the trade made become a winner, but the lesson here for me is simple:
Trade what you see, not what you think.
I believe I've seen that on StockTwits at least 10,000 times. LoL
Sunday, November 28, 2010
Mind those gaps
As a football player in high school, one key element of defensive line play that I was taught was to play gaps in the offensive line. Many of our defensive plays involved exploiting various gaps in the line with stunts, crosses, etc. Success was not always guaranteed, but I was rewarded often enough with my "gap fill" plays.
The same holds true in stock movements. One type of trade that I do is called a "gap fill". This stock movement can be either up or down, but typically the play involves a stock that has gapped down - then begins finding buyers at a support level.
I differentiate this play from a "knife catch" in that I only focus on this move after the knife catchers have done their job. The stock is skipping along a horizontal support line while it begins to build a new base. Once I feel confident in the horizontal support, I begin to stalk for any sign of building strength. Once I see the strength, I begin to plan my scaling in strategy to "fill the gap" above.
A recent example that I would highlight here is SKX (Skechers USA Inc.). In late October, this stock gapped down from 23 to under 20 in one day. The stock then churned around this level, and after a week I began to scale in to a long position. I had a full position once the stock closed above the 8d EMA. On November 24, the stock had successfully filled the gap above to close above the 23 level.
Friday, November 26, 2010
Don't stick your head in the Sand (isk)
I have had a stock setup for while that I wanted to put on SNDK (Sandisk Corp). As a member of my UP stalk list, I waited for a big up day on the stock to do the following trade:
Buy 1k shares of SNDK at 45
Sell 10 46 strike Dec calls at 1.49
Buy 10 44 strike Dec puts at 1.33
The option trade portion was put on for a net credit of .16c -- I got paid to protect those shares. Since I expected a pullback short term, I was ok with capping the upside at 46.
So why do this trade now? By having patience on Wed, I caught the stock on a big up day. This makes the upside calls elevated (good for selling), and the downside puts much cheaper (good for buying). As the stock pulls back, I'm ok with that because the puts go up in value (thus offsetting the unrealized loss in the underlying common). I do have the option to buy back those upside calls at any time during a pullback and keep the difference in premium (thus lowering my cost basis for those downside puts).
Wednesday, November 24, 2010
Be a good listener
I had a great experience this week involving a particular stock that I had bullish view on. The stock was NWL (Newell Rubbermaid Inc.). I had posted my chart here: http://chart.ly/i3dcjdc and received a comment from another trader on StockTwits.
The great thing about our exchange? We both listened. We both digested the opposing view, perspective, and thoughts. I elected to adjust my view to one of more caution -- to let the pattern develop a bit more. That patience paid off as the pattern did develop in to a Trend Reversal, thus providing a much improved entry to the stock (16.8). Today, the stock showed great follow through (with great volume I might add).
I've always prided myself in being a good listener, but find it ever more important with so much at stake (like real money!). Make sure you are a good listener. It is ok to be wrong, just know when you are -- and adjust.
Sunday, November 21, 2010
Put on those welding gloves
Falling Knife
"A slang phrase for a security or industry in which the current price or value has dropped significantly in a short period of time". Investopedia
One of the more difficult stock trades to execute has to be catching a "Falling Knife", otherwise known as knife catching. I have received numerous requests for my philosophy on trading stocks that fit this profile, so I thought I would provide some of my thoughts in a more comprehensive post. Although I believe most traders will avoid this type of trade due to its higher level of difficulty, I believe that a carefully thought out plan can provide one with a tremendous risk/reward scenario.
So, why the comment "put on those welding gloves"? By using this comment, I hope that I am demonstrating that special care is required (and prudent) in trading a falling knife stock. Other components of the strategy required:
1) Patience. Often these stocks that are falling in significant way, may do so for several days. This may actually provide a short-term short trade while you look for a "bottoming" of the stock.
2) Ability to understand clear support lines in a chart, including Fibonacci levels from the recent up or down move.
3) Basic understanding of the FA event that caused the gap down. Even for those that are pure Technical chartist, I advocate a basic understanding of FA in this strategy.
4) Good understanding of price action as the stock finds a bottom (sometimes I refer to this as the "skipping rock on water" phase).
To help wrap all this together, let's study CPB (Campbell Soup Co). At present, This stock is putting in a new base down in the 34.5 price level - this after a gap down from 36.25. CPB has been building this new base for 7 days. I have alerts set for a break above the 34.8 level, and a break below 34 (which would cause me to view this trade as a failure at support).
As always, feel free to send along your comments/suggestions/criticisms. Thanks.
Derald
Subscribe to:
Posts (Atom)