Saturday, April 16, 2011
Blog Posts
If you are not already aware, I now blog using Wordpress. You can find my new blog location at http://1nvestor.wordpress.com
Thursday, February 24, 2011
The squeeze play
From Wikipedia:

Squeeze play (baseball)
"In baseball, the squeeze play is a maneuver consisting of a sacrifice bunt with a runner on third base. The batter bunts the ball, expecting to be thrown out at first base, but providing the runner on third base an opportunity to score. A bunt can be attempted with two outs but it is uncommon because there is a significant chance that the batter would be thrown out at first base, ending the inning. Likewise, such an attempt is unlikely with two strikes because a bunt attempt that is fouled off is an automatic third strike. The squeeze play is said to have been invented on the baseball field at Yale by George B. Case, who later went on to found the white-shoe law firm White & Case.[1]
In a safety squeeze, the runner at third does not take off until the batter makes contact bunting, waiting for more certainty that the ball will go to a location from which it will be difficult for the fielding team to make an out at home plate.
In a suicide squeeze, the runner takes off as soon as the pitcher begins to throw the pitch, before releasing the ball. If properly executed, a play at home plate is extremely unlikely. However, if the batter fails to make contact with the pitch, the runner is likely to be put out at home plate (hence, "suicide"). Therefore, the suicide squeeze usually requires a skilled bunter who can make contact consistently, even on difficult pitches.
These plays are often used in the late innings of a close game in order to score an insurance, winning or tying run."
In order for the above play to be executed with success, it takes practice, skills, preparation and timing. And although success is not guaranteed, teams will attempt the play for a variety of reasons (some noted above) as part of their strategy for winning the game.
When compared to stock trading, there are a lot of similarities for traders to follow. However, for this post I wanted to focus on the something quite relevant: the Bollinger Band squeeze play. Below is an example of a chart showing a severe tightening of the Bollinger Bands on the Daily chart for AIG (American Internat Group):
 As you can see, the upper and lower Bollinger Band have constricted the price into a VERY tight range. What attracts me to this setup is the expected outsized move out of this tight range - it could be up or down. Price moves out of these squeeze patterns are usually significant and thus provide a good Risk / Reward in my opinion.
In a safety squeeze, the runner at third does not take off until the batter makes contact bunting, waiting for more certainty that the ball will go to a location from which it will be difficult for the fielding team to make an out at home plate.
In a suicide squeeze, the runner takes off as soon as the pitcher begins to throw the pitch, before releasing the ball. If properly executed, a play at home plate is extremely unlikely. However, if the batter fails to make contact with the pitch, the runner is likely to be put out at home plate (hence, "suicide"). Therefore, the suicide squeeze usually requires a skilled bunter who can make contact consistently, even on difficult pitches.
These plays are often used in the late innings of a close game in order to score an insurance, winning or tying run."
In order for the above play to be executed with success, it takes practice, skills, preparation and timing. And although success is not guaranteed, teams will attempt the play for a variety of reasons (some noted above) as part of their strategy for winning the game.
When compared to stock trading, there are a lot of similarities for traders to follow. However, for this post I wanted to focus on the something quite relevant: the Bollinger Band squeeze play. Below is an example of a chart showing a severe tightening of the Bollinger Bands on the Daily chart for AIG (American Internat Group):

In scanning for these patterns, just instruct your scanning software to look for stocks that have an upper Bollinger Band that has been decreasing for 5 days, and a lower Bollinger Band that has been increasing for 5 days. Obviously you can play around with those settings to expand your results list.
Another example from a trade today was with MILL (Miller Petroleum). Here is an updated chart showing the up move:

Although the stock printed a massive Shooting Star on this Daily chart, the point here is that the move out of the Bollinger Band squeeze was significant.
Wednesday, February 23, 2011
Stop and take notice

One of the key elements to my trading strategy involves the use of Stops. The graphic above provides a brief description of a Trailing Stop, from the Investopedia web site. This week has certainly provided a lot of good examples for why stops are so vital in capital preservation - either to lock in gains, or to keep losses to a minimum.
As stated many times on StockTwits, cash is indeed a position.
As far as how to set stops, whether it be on a percentage basis or a dollar amount, that is something that I leave up to you. Some folks use mental stops as well. Each person has their own Risk/Reward strategy (hopefully) and should stick to that no matter what trading ideas are obtained. For me, I try to anticipate what the stop hunters are going to do - and I just try to stay ahead of them the best I can. Obviously I am not always successful in winning each "battle" - but as long as I win the war I am fine.
Tuesday, February 22, 2011
Parting the Red sea

As many of us stare at our trading system screens, it is clear today that we are in the midst of a RED day for most stocks. It can certainly be frustrating to see positions in the red, with rays of goodness here and there as some positions are surviving the selling pressure.
One of the real challenges for traders is to accept the reality of the day, and yet still be able to focus on new setup opportunities (at least for those that have cash to put to work). I found myself this morning with a nice list of 20 or so setups, but with a plan to execute that did not call for a down market. Although I did have several short setups in the list, the majority of the stocks on the setup list were for long positions. Now what?
There are certainly several options to traders on days like today. Here are a few:
- One could just decide to stay out of the market altogether, nothing wrong with that.
- One could decide to only trade options on any dip buys that look attractive.
- Another option is to just dig in and really push yourself to find the most opportunistic setups. This will certainly take more work than usual with a market that is taking it on the chin.
I chose SPRD (Spreadtrum Communications Ads) and APKT (Acme Packet) as moving average bounce buys. SPRD was in play right out of the gate, but APKT took quite some time this morning to finally work its way to a bounce price area. Here is a chart of SPRD posted on February 20, 2011 that shows what I was looking for in terms of a move:

For APKT, I had to have a lot more patience today as this settled down just above the 68 level this morning. This my chart from earlier in the day:

I ultimately took the 22 print on SPRD to close the long position as it appeared to stall. I remain in APKT as it tries to hold the 69 level, with a stop at the LOD (low of day).
Sunday, February 20, 2011
Are the markets open yet?
Since the U.S. markets are closed on Monday for President's Day, traders are enjoying a 3-day weekend. It is a great time to wax the car or do maintenance on the lawn mower. Crazy thought, I know. Whatever, the lawnmower can wait. LoL.
For me, my plan was to take advantage of the extra day to do a deeper review of all my trades for the year up to this point. In doing this review, I have uncovered a surprising statistic (to me) on my trade breakdown %:
Long 71%
Short 29%
In no certain terms did I expect this result, and I actually reviewed the spreadsheet calculation several times looking for errors. Despite my perception that I have been primarily Long this year, just over 1/4 of the time the trade I put on was bearish (this does include option trades, not just equity). To further confuse myself, several of the ETF trades that I am long are bearish ETFs (like ERY & SDS). LOL.
Primary criteria in the calculation % was based on position size and when the trade was closed.
So in summary: I am Bullearish. And I do think Tuesday will have folks chomping at the bit, more so than usual -- so be prepared for that.
Thursday, February 17, 2011
Code Name: OpEx
Each month there is an event for option traders that adds a LOT more excitement, frustration, whipsaw action to trading options: Options Expiration. February 19, 2011 is the day for this month. I do a great deal of option trading, either as a straight option only trade, or as part of a combination or hedge trade so I am right in the middle of the mayhem. I typically spend a great deal of time in the prior weekend planning my option trade tasks so that I am prepared to deal with any remaining trades that I have on.
This month I have 7 put spreads sold that I expect to expire, thus allowing me to keep the premium collected when I sold them. I do have several Feb put trades that are in place for protection on long positions, so I will be rolling those to March. I have 2 Feb call positions left that I am currently rolling to March as well.
The remainder of my option trades are for March or future dated months so I do not need to address them at the moment.
I do employ several strategies with my option trades and here are a few:
Friday OpEx is usually a very wild day as stocks try to pin to certain strikes, so strap in and hold on.
This month I have 7 put spreads sold that I expect to expire, thus allowing me to keep the premium collected when I sold them. I do have several Feb put trades that are in place for protection on long positions, so I will be rolling those to March. I have 2 Feb call positions left that I am currently rolling to March as well.
The remainder of my option trades are for March or future dated months so I do not need to address them at the moment.
I do employ several strategies with my option trades and here are a few:
- Selling put spreads as a bullish bet. The goal is primarily to keep the premium collected at expiration, but there are times where I am able to take off parts of the trade (buy back puts at a lower price for example) and then put the trade back on at a strategic moment.
- Buy call spreads when I want to make a heavier bet in a stock.
- Stock replacment. I often do this when I am long a stock that makes a large up move. I will sell the common and take some of the profit to buy calls.
Friday OpEx is usually a very wild day as stocks try to pin to certain strikes, so strap in and hold on.
Wednesday, February 16, 2011
Do you have the time?

One of the important tasks in reviewing the chart of any stock is to be sure to look at multiple time frames. A noted member of StockTwits, Brian Shannon (twitter handle @alphatrends) covers this in great detail in his book.
Over the past several months, I have added several columns to my stalk list spreadsheet to include a ranking system based on the charts from different timeframes (daily, weekly, monthly, quarterly, & yearly). The more corelation I see, the higher the ranking I am going to give a stock - in terms of the increase in probability of the direction in the stock price movement. An example below for WEBM:


As you can see in the 2 charts above, a nice pennant has formed on both the Daily & Weekly charts. This helps to see a confirmation of a high probability for price to continue heading in to the apex of the pennant/triangle.
Tuesday, February 15, 2011
Hit the sell button
This week presented me with a great example of why it is important to sell into strength. You no doubt see various traders on StockTwits make this point often. It certainly is important to let your long winners run while you raise those trailing stops, but it is equally important to take some profits along the way.
For my example this week, I bring you MIPS (Mips Technologies Inc). As has been the case lately, Monday showed us a lot of strength out of the blocks for many stocks. I was long the Feb 12.50 strike CALL (35 total contracts at one point) and decided to keep an extra close eye on it as the stock was making a very strong move.
Once the stock hit the 14.50 level, I began to plan selling some of my calls as it had more than exceeded my initial target. As the upside strength continued, I decided to shoot for a print of 15 on the common in hopes that my calls would show a 2.50 print or better. They did. I took most of it off during a 20 minute window where the stock was hanging around 15, then adjusted my trailing stop on my calls to 2.25 on the balance. The stop did hit and the trade is now closed.
In looking at MIPS today, it is struggling to hold 14 so this is quite a pullback from the high reached on 2/14.

Take those profits and raise those stops along the way.
Sunday, February 13, 2011
Titanic hunting

In reviewing my current options trades this weekend, I noticed something in one of my VMW (Vmware Inc.) charts that I thought I would use in discussing how I scan for bottoming stocks. This is when I am "down in the sub" or "down with the Titanic" looking for stock that are in the last stage of a pullback.
One of the stock scans that I run is used to find stocks that have a Stochastics reading of under 30 (among other criteria, but this is what is important for the sake of this post). Here is a recent chart of VMW showing the Stocastics readings that hit my scan and corresponding rise in stock price after the dip buyers begin to come in:

A simple strategy yielding a high probability trade opportunity. In the words of @Fibline, KISS.
Saturday, February 12, 2011
Secret Sauce
Everyone wants to know what the Secret Sauce is - For this, I can be 100% sure of.
Now that your life is forever changed knowing the Big Mac recipe, on to the real important stuff. LOL. So what do I view as my Secret Sauce? What components in my trading (the ingredients if you will) give me an edge over others?
You are in for a big let down here (sorry) as I reveal that this is no real secret at all. The one component (or ingredient) to my Secret Sauce that I often discuss is: Preparation. Part of my weekend routine involves building an updated set of Stalking Lists for the upcoming week. In doing so, I build an Excel spreadsheet that contains all the stocks that I want to keep a close watch for (and set price alerts for). Here is a sample of my spreadsheet:
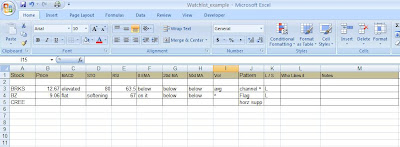
I typically will have 50 or so stocks by the time I build the list on my first draft. I will then spend time focusing on the filtering process to get the list down to 20 or less by Sunday evening. Having the list in Excel allows me to do a lot of data sorting, formula creation, etc. so it is something that I recommend to everyone.
My Secret Sauce, maybe. A recipe for success, I think so.
Friday, February 11, 2011
BB
This could be an abbreviation or shortcut for several things like Basketball, Bolling Bands, BB gun. But let's talk about stock scans. What I would like to share here is a scan I use to try to find Bollinger Band squeezes.
Using http://www.stockfetcher.com/ put in the following filter:
Show stocks where lower bollinger band(30) has been increasing over the last 8 days
and upper bollinger band(10) has been decreasing over the last 8 days
and Average Volume(90) is above 500000
and close is between 5 and 250
I would suggest that you modify the band(xx) settings to see a variety of results. There are likely other ways to accomplish a resulting list, but this works well for me.
Happy Hunting
Thursday, February 10, 2011
Preparation H
Now that you are here reading this, I am sure you are wondering just what on earth a tube of cream has to do with stock trading. You can relax now and loosen those butt cheeks.
Let's talk about Preparation and the H? Well that is Hard Work. Two things that are required to improve your chances of success in stock trading (heck, in anything you do). Hopefully each of you have a good solid approach to getting prepared each day you trade. For me, I have a very structured routine:
As for the H for hard work, this is what my process outlined above really is. It is hard to go through this routine each day. It is hard to be thorough and keep your trading plan up to date. It is especially hard to look at the pre market and see a lot of RED when you have 10 great Long setups! LoL
All kidding aside, remember this old adage: "You get out of life what you put into it". Be prepared and work hard - I would expect you to see better results in whatever you do.
Let's talk about Preparation and the H? Well that is Hard Work. Two things that are required to improve your chances of success in stock trading (heck, in anything you do). Hopefully each of you have a good solid approach to getting prepared each day you trade. For me, I have a very structured routine:
- I go through my Trading Journal for the whole week. Yes, I review the entire week - no matter what day of the week it is. This helps me get into the flow of any trades that still in play.
- I then review my Stalk Lists and will do some basic review of news events that may impact stocks on my lists. I will also look for any stocks that have made unusual moves in after hours or pre market.
- I will review briefly the indexes and futures, but really do focus on individual stocks for the most part.
- I then review current trades and where I am with each trade. Often I have a trade that is carried overnight so I may need to act on it pre market. Today for example I was reviewing an open trade in WFMI that I held a partial of overnight.
- One final thing I do is get caught up on any reading that I want to review before the market opens.
As for the H for hard work, this is what my process outlined above really is. It is hard to go through this routine each day. It is hard to be thorough and keep your trading plan up to date. It is especially hard to look at the pre market and see a lot of RED when you have 10 great Long setups! LoL
All kidding aside, remember this old adage: "You get out of life what you put into it". Be prepared and work hard - I would expect you to see better results in whatever you do.
Wednesday, February 9, 2011
Earn it
Now that we are well into earnings season, today seems like a good day to address the common question that I get regarding earnings reports: "are you holding in to earnings". Truth be told, it not possible for me to answer these questions in a general sense (although some say never do this) but certainly I can answer on an individual stock basis.
My strategy for the most part is to hold up to the earnings release, what many call the earnings run up. I then assess the stock movement in the last hour or two before the release to determine what I want to do. Depending on the situation I will:
AKAM
CSCO
WFMI
Which one would you choose to hold into earnings? I went with WFMI for several reasons. One, I was stalking it all week for a Break Out over a key resistance level. But more importantly, I liked the earnings report and reaction last quarter - I expected it to be similar (or better) this time.
I did take some off after hours already and have moved my stop up to 57 on the balance for now.
My strategy for the most part is to hold up to the earnings release, what many call the earnings run up. I then assess the stock movement in the last hour or two before the release to determine what I want to do. Depending on the situation I will:
- Sell the equity and move into calls or puts.
- There are occasions where I sell a partial and hold the rest into the earnings release.
- On some particular stocks, I choose to hold all - especially if I have great conviction - and back that up with a heavy bet (long or short).
AKAM
CSCO
WFMI
Which one would you choose to hold into earnings? I went with WFMI for several reasons. One, I was stalking it all week for a Break Out over a key resistance level. But more importantly, I liked the earnings report and reaction last quarter - I expected it to be similar (or better) this time.
I did take some off after hours already and have moved my stop up to 57 on the balance for now.
Tuesday, February 8, 2011
Glossary of Terms
I have put together a draft of some of the terms that I use in my charts. It is by no means an authority on Technical Analysis terms, but a collection of abbreviations and simple analogies to describe what I see in a chart. I will add to it when appropriate, so feel free to send anything along that you would like added, updated, or changed.
Glossary of Terms
Abbreviations & Other Identifiers
\ | Down |
^ | Up |
100d | 100 day moving average |
10d VWAP | 10 day Volume Weighted Average Price |
200d | 200 day moving average |
20d | 20 day moving average |
50d | 50 day moving average |
Abv | Above |
B/D | Break Down |
B/O | Break Out |
BB | Bollinger Bands |
CnH | Cup and Handle pattern |
Conf | Confirmation |
Curl Up | Uh, it is curling up |
Down with the Titanic | I think you get this one. See In the Sub. |
Fib Line | Fibonacci Line : 23.6, 38.2, 61.8 etc. |
Fish Lips | Just picture fish lips. I use this reference when speaking of Bollinger Bands |
| HH | Higher High |
| HL | Higher Low |
| HnS | Head and Shoulders pattern |
Horz Supp | Horizontal Support |
In the Sub | I am in my submarine, bottom fishing |
Inv Hammer | Inverted Hammer |
J-hook | J hook pattern. Pattern formation is a J |
L | Long |
| LH | Lower High |
| LL | Lower LL |
MACD | Moving Average Convergence Divergence |
MACD Rocket Ship | Easy to understand |
MACD Ski Jump | Just picture a ski jump. |
MACD x^ | MACD cross up, a powerful event that preempts a nice up move |
Marshmallow on-a-stick | A really long shadow on a Hammer, Inv Hammer, Hanging Man or even a Shooting Star |
| MM | Measured Move |
O/B | Over bought |
O/D | Overdone |
O/S | Over sold |
RES | Resistance |
S | Short |
Stalking | May sound bad, but just notes there is an emphasis on watching this particular stock VERY closely (including setting price alerts long or short) |
STO | Stochastics |
Supp | Support |
TL | Trend Line |
TR | Trend Reversal |
VaP | Volume at Price |
Vol | Volume |
VWAP | Volume Weighted Average Price |
Waterfall | Indicator moving, well, down like a waterfall |
Monday, February 7, 2011
Just a trade
Given the increased "why the heck are you selling" messages, I wanted to quickly put out on a post to cover the concept of Trading Goals. In order to fully be prepared in a trade, it is important to have the goals defined for why you are doing the trade in the first place.
I have found it to be increasingly important when I am initiating a new day trade to ensure that I note if it is meant to be such: it is "just a trade". I would like to offer why this is so vital to mental preparation in stock trading in that this is meant to ensure that I keep emotions in check. You can not marry yourself to a stock. In fact, the importance of defining my goal for the trade is enhanced because I may have a position on the same stock in another account (like my LT account for instance) which is in place using a defined set of goals for my Long Term strategy.
A trade that I define as just a day trade will have a few simple goals which includes my time frame for executing the trade, expected targets, and may include a very short leash (tight stop).
Today I have scaled out of all my positions that I held over the weekend in my day trade account. The new positions I added today, AIG & UAL, I have scaled out during the day as I felt an afternoon fade was brewing.
My trading style and philosophies are not fool proof, but the inclusion of goals & discipline help to ensure that my trading performance remains profitable - whether I am long SBUX, whether I am short NFLX, or whether I find myself in all cash.
Sunday, February 6, 2011
Bandaids required

Ouch, that looks like it could hurt. You may see me make a comment from time to time on twitter about using Welding Gloves. I use this as a simple analogy in that I am just trying to highlight a key element in my trading: Be prepared. Some trades simply require more attention and caution, and some require a realization that there is enhanced difficulty in finding an entry in the first place.
This past week I embarked on several Knife Catch trades, including one that had been simmering for just over a week (FFIV, F5 Networks). The other KC trades that I focused on were BRCM, F & WHR. I have been getting some good feedback throughout the week regarding these trades (I am open to feedback no matter what kind, including criticism). I received great questions with several on something quite simple: WHY !!
In answering that question of "why do you do this trade", I would like to walk you through my thought process on trade setup - soup to nuts. First and foremost, my trade preparation involves running stock screens (as well as getting trade ideas from StockTwits). Because I like a variety of trade opportunities (long and short), I run all my scans each night and during the weekend. These scans will produce KC trade opportunities daily. However, some of these KC trades don't allow for much preparation (sudden gap down for example), so at times I pass on the opportunity for this reason.
After looking at all the scan results, I try to pare the list to under 50 before I start my "real" filtering process. This part of trading preparation will be harder to define easily as I have a lot of nuances that I am looking for. For the purpose of this post though, I will stick to Knife Catch trades. Since I often run several different Stalk Lists, including one just for KC trades, I have to be good at one aspect of trade setup once I build all of my Stalk Lists: price alerts. It does little good to do all the preparation, if you fail to set price alerts on stocks that you want to monitor. You will see me tweet about this from time to time, it is no fun when I fail to set my price alerts and then later realize that I have missed an expected move entirely. A trade "whiff" if you will.
In the case of the 4 trades mentioned above, I had running 5 minute charts as well as other time frames. My rationale for choosing the 4 is this: all 4 stocks had a key element in common as they were all 4 what I deem to be well known or followed stocks. I do take this into account in my filtering process. I do use Fibonacci in these trade setups as I want to have a solid idea of where I think price will revert to. I can not stress enough on just how important this is in my target identification.

Updated. Holding abv supp (42.7). Knife Catch play in progress from A/H.
Feb. 2 at 10:06AM | Bullish > Bullish Unassigned
I predominatly scale out of my trades and so I will define a range of return on the trade overall. This will not always work well, and this past week was no exception. In reviewing my BRCM trade this weekend in more detail, I simply did a poor job of assessing where I was in the trade - after each time I scaled out a portion. I was focused on a return, but ignored other factors in the stock price and volume that were big clues to further upside. Although I re-entered long in the trade on a pullback, I clearly lost some additional return on the trade due to this mistake.
I remain long a full position of BRCM and 1/2 of F and FFIV from the trades mentioned here. I closed out the WHR long position, and although it has run to the upside further, I am more than satisified with the trade performance.
So in summary: Be Prepared, have a plan, execute the plan. Repeat.
Friday, February 4, 2011
Patience
One of the important aspects of trading stocks, beyond a day trade perspective especially, is patience. In keeping my normal routine of updating my Trading Journal this week, it became apparent to me that this was a major leak in my day or swing trade execution this week. A major leak.
I have 3 trades to point to, ironically all 3 Knife Catch or support bounce plays, where I was simply in too big of a hurry to exit the trade with gains. In one of the three situations, I did re-enter Long after a minor intraday pullback - so at least my trading execution was improved there (BRCM).
In the case of WHR & SNDK, after assessing why I had such a short leash on the trades, it appears that my lack of patience led me to set weak upside price targets. Once the target was hit, I scaled out as usual, but did not put enough energy into reassessing the trade. A major fail here, given the time for preparation and scaling in to the trades in the first place. I will do further review this weekend, after my head is more clear, to determine where improvements can be made.
I need to find a Doctor that is accepting new patience, uh er I mean patients. LoL
It is Friday, NFP is out, so trade accordingly.
Thursday, February 3, 2011
Ring around the collar
The definition of an option collar:

As a follow up to my post on 2/2/2011 regarding APKT, I thought I would expand a little on my use of an options collar to protect the gains. I received numerous questions surrounding my strategy here, and will try to answer those within this post.

As a follow up to my post on 2/2/2011 regarding APKT, I thought I would expand a little on my use of an options collar to protect the gains. I received numerous questions surrounding my strategy here, and will try to answer those within this post.
The thought process here is simple: you have an enormous gain in one day and want to protect the gains. You have choices here on what you can do - here are just a few:
- Stock replacement. Sell the common stock and buy a straight CALL. This locks in the initial gains on the common stock and allows participation of further upside - with MUCH less at risk (cost of the call).
- Buy a PUT to protect the common stock you own
- Put on a collar (sell an OTM CALL to purchase an OTM PUT). This can usually be done for pennies.
- Sell the common stock and take the day off. LoL
I had the expectation that the stock would pullback soon, so I chose to put on a collar. I paid $.20 cents to put the collar on. However, one of the downside potentials to this trade is that any further gains are now capped. In the case of my collar, the strike on the OTM CALL was 67.50.
This morning I sent a tweet about the likelihood of the stock being called away, as the price was moving through 69 with great momentum - and thus was a profitable trade for my CALL buyer(s). However, it did not stay strong for long and quickly weakened. The stock currently sits at the 66 level, which is perfectly fine for me.
The next part of this strategy involves the planning of buying back the 67.50 call before expiration. If I see renewed strength on the horizon for the stock, I will consider doing this - especially if the price for the CALL falls under 1.00. If the stock price holds in the mid 60's, I will do nothing and let the collar expire.
Wednesday, February 2, 2011
Roadrunner
As a kid (ok, even today) I enjoy the battle that ensues in the Roadrunner cartoon. ACME always seems to be more than adequate to stop Roadrunner, but falls short over and over. Clearly it is user error at times, LOL.
Today however, ACME (Acme Packet Inc) stock is not falling short. The stock has experienced an almost 20% up move today off of their earnings report on 2/1/2011. I have been executing on my plan to deal with my long position, which included selling partials in to the strength. I hope any of you that are long are doing the same.
Once I was down to a 1/2 positon left, I was at a crossroads. This is a Long Term account holding, so I have a certain strategy with holdings in this account. A move of this magnitude seems outsized, so it seems prudent to protect the gains. I elected to put on a Feb 62.50/67.50 collar at a net debit of $.20. This trade protect me on the expected "fade" or pullback, but also caps the gains on the remaining shares at 67.50.
As of noon CST, the stock is continuing to advance and is nearing 67 a share. Oh boy. I am at risk of the stock being called away at any time, but likely over 69 the call buyer gets interested. We shall see.
Beep Beep.
Monday, January 31, 2011
The Reaction
re·ac·tion (r -
- k
k sh
sh n)
n)
-kshn) n. 
1.
a. A response to a stimulus.
b. The state resulting from such a response.
2. A reverse or opposing action
One of the frequent trading opportunities, each and every trading day, involves stocks that have an unusual move (up or down). These moves can be caused by a variety of events, like earnings or a big contract win. The opportunity lies in the "reaction" by traders to these events which often causes "outsized" moves - price moves that are outside the norm of movement for that paricular stock.
Part of my overall trading strategy is to always keep available funds in my daytrade account for such opportunities. This past week, MUR (Murphy Oil Corp) presented such an opportunity as it came under tremendous selling pressure. One could view this as a knife catch opportunity - that would be appropriate.
So why do this sort of trade at all? I get questions often that reflect this sentiminent, and I have no issue with that all. It certainly is not for everyone. However, it is my view that these emotionally driven stock price moves present enormous opportunity - when approached correctly and with the right mindset.
In the case of MUR, the stock was gapping down in to the mid 60 area (and right through a 50% retracement from the most recent up move). The stock caught my attention based on the volume in the stock up to that point in the day. My process with a trade like this is to start off with a quick review of the chart to determine where I think support will come in to play. In the case of MUR I determined that the price would most likely fall through the 65 level, but after that level I had the expectation that dip buyers would begin to show up. I made an initial buy and then made 2 subsequent adds as it began to recover up through 64 and abv the 65 level. Based on the fibonacci levels for the intraday move, I determined that anything above 66 would be a great exit and scaled out accordingly - once that price target was achieved.
Monday of this week has started off with another similar opportunity, this time in APA (Apache Corp). This stock suffered through some intense selling on 1/28 (Friday of last week, due to issues in Egypt), but began to show some real buyer interest out of the gate today. I made an initial entry at the break above 115, and then added on a move through 116. I scaled out of 1/2 as it went through 117.50 and moved the stop up on the balance. The stock has moved up through the 119 level as of the close of day today.
Good luck on Tuesday as we start a new month, February 2011. Wow, January is in the books folks!
Tuesday, January 25, 2011
Down in the Sub
One of the many aspects to trade preparation involves the task of doing stock scans. Many traders use a variety of products either as part of their trading platform, or through 3rd party providers. What I want to highlight today is a particular scan I use to find Stochastics that are bottoming.
In my http://chart.ly/users/1investor chart postings, you may see me note things like "STO bottoming" or "STO curling ^" or even "STO _". I am sure you wonder sometimes what I really mean here. So I would like to provide an example from a trade that I put on last week.
The trade involves AMED (Amedisys Inc). I ran a scan use Stockfetcher to find me stocks that had a Stochasitcs reading under 20. After parsing through the list, I focused on this stock as it was pulling back to a rising 50 dma. The timing of the "STO curling ^" seemed to coincide with a test with that 50 dma. The addition of a hammer being printed on the daily chart gave me several reasons to put this near the top of my list.

The chart for today shows that the stock is testing prior Resistance (as well as the 20 dma) at the 33.30 level and is likely to flag here as it prepares for its next move. I am using 32 as my stop.
So the next time you see a comment from me about being "down in the sub", you'll have some idea of what I have been up to, uh er, down to. LOL
Thursday, January 20, 2011
Tools
I have been receiving an increasing number of messages asking for information on what web sites / tools I use in trading. Although some of these encompass other areas of interest to me, they are included as they add value in preparation, market analysis, or information gathering.
http://www.finviz.com/
A site that all traders should use daily. A wealth of information, scanners, market gauges. Did I mention the scanner? LoL
http://www.thepatternsite.com/
I use this site a lot when I want to look at detailed candle patterns, etc. If you are dedicated to candle reading, this site is for you.
http://barchart.com/
For newer traders, the Cheat Sheet section may be of great interest. Another site with an enormous amount of information in one spot. Spend time here.
http://bloomberg.com/
Good source of information, perspective.
http://freestockcharts.com/
I use this site primarily to create my charts.
http://chart.ly/
Site that I post my charts to. The link to my charts is: http://chart.ly/users/1nvestor
http://decisionpoint.com/
Good TA information
http://stockfetcher.com/
I use this site a great deal for my scans. Play around here, you will be glad you did.
http://nytimes.com/
Wednesday, January 19, 2011
RiverRed
I've spent some time in A/H today watching the FFIV (F5 Networks) carnage unfold, as well as reviewing the RVBD (Riverbed Technology Inc) trade that I put on earlier today. My plan for putting a trade on in RVBD centered around it holding above the 38 level. Once I felt that It was doing so, I elected to sell the FEB 38 put for 2.60. I did not mind owning it at 35.5 essentially, if put the stock - for some reason. To finish off the put spread, I bought the JAN 34 put for .10c.
In reviewing the chart, I could see a rising 20 dma & 50 dma (moving average) below coming up to the price area. I felt for sure that one of those levels would hold if something dire happened. Oops.

Now I find myself with RVBD trading just above the 33 level in A/H. Clearly I am at risk of being put that stock, but I do own that JAN put that is now ITM (in the money).
In reviewing the chart, I could see a rising 20 dma & 50 dma (moving average) below coming up to the price area. I felt for sure that one of those levels would hold if something dire happened. Oops.
Now I find myself with RVBD trading just above the 33 level in A/H. Clearly I am at risk of being put that stock, but I do own that JAN put that is now ITM (in the money).
Tuesday, January 18, 2011
Know your options
I get a little extra cautious, nervous, and excited during OPEX week. The expiring of options add a lot to trading during the week as traders position themselves - and deal with trades that may be expiring. This week has an added dimension in that 2 of my trades are in stocks that have earning releases: AAPL (Apple Inc) & GOOG (Google).
To make things even more exciting, AAPL had some significant news come out over the holiday involving their CEO Steve Jobs. He has taken another medical leave of absence. I spent a fair amount of time coming up with my trading plan for AAPL today as I viewed it as a great opportunity. I ultimately decided to sell the FEB 300 put and buy the JAN 340 call once the market opened. The trade lasted less than 20 minutes and provided a net of 6.80 on average (scaled out). I then reviewed the action up to that point and elected to wait for the JAN 340 call to retrace (which it did) - I then picked some up at 5.60. I will hold these through earnings amc.
In terms of my GOOG option trade, I began to think that this may get even more attention because of the negativity towards AAPL that some may have. The action so far today solidifies that view. I currently have the following trade on:
L JAN 660 call
S JAN 590 put
L JAN 575 put
The above trade was done for a net debit of 1.90
There are a variety of ways to play these earnings releases, you just need to know your options.
Subscribe to:
Posts (Atom)